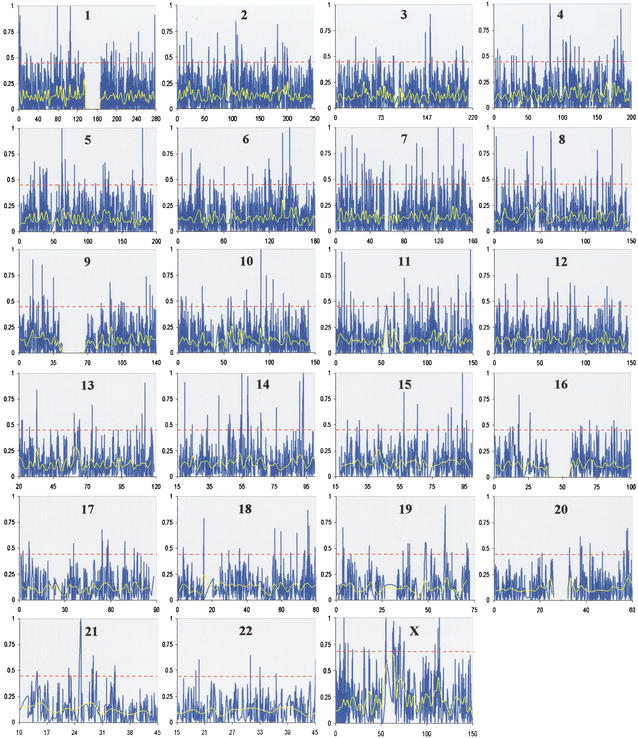
Figure 3.
Chromosomal distribution of FST. For each chromosome, chromosomal position in Mb is shown on the X-axis, and FST is plotted on the Y-axis. FST values for individual SNPs are shown in blue, and the average FST for nonoverlapping 1 Mb bins is plotted in yellow. The red horizontal lines in each panel provide a guide for identifying exceptionally high-FST values (corresponding to the upper 2.5% of the empirical distribution of FST; notice the higher threshold for the X chromosome). SNP density is proportional to the line spacing, and although the overall density is high, several large gaps were observed (e.g., see chromosomes 1, 9, 16, and 20). These gaps correspond to heterochromatic staining regions found near the centromeres of these chromosomes. The Y chromosome contained only seven SNP markers with allele frequency data and therefore was not included in subsequent analyses.

