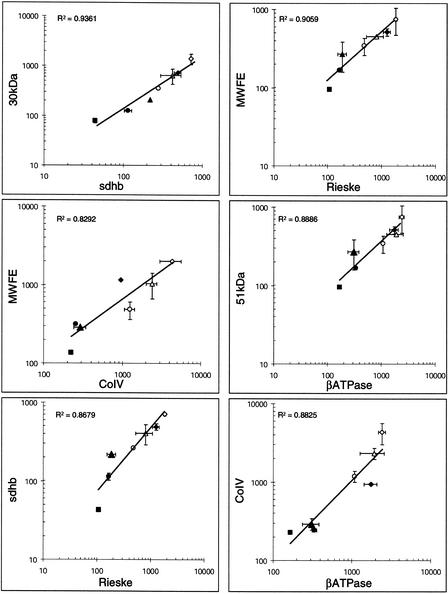
Figure 7.
Correlation between the abundances of the nuclear OXPHOS transcripts in the different tissues and cells. Correlation coefficients (R2) are given in each panel. (⋄) Muscle Ambion; (♦) muscle Clontech; (▴) liver; (●) kidney; (▪) trachea; (○) 143B cells; (▵) control fibroblasts. Statistical fluctuations of the values were reported as horizontal and vertical bars.

