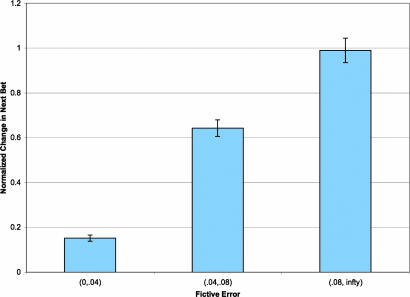
Fig. 3.
Influence of fictive error signal on behavior. Barplot of the average normalized change in next investment versus the level of the fictive error. Changes in investment were converted into z-scores within each subject. The fictive error signal was binned into three levels [(0.00, 0.04), (0.04, 0.08), (0.08, ∞)] for the figure (see SI Fig. 8 for a scatterplot). Error bars are standard errors.

