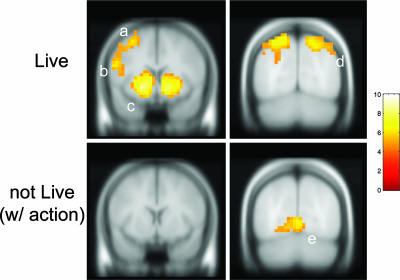
Fig. 4.
Brain responses to fictive error signal. (Upper) SPM t-statistic map for the fictive error regressor (ft+) showing activation in motor strip (a), inferior frontal gyrus (b), caudate and putamen (c), and PPC (d). Threshold: p < 1 × 10⁻⁵ (uncorrected); cluster size ≥5. Slices defined by y = 8 and y = −72. Random effects over subjects, n = 54. (Lower) SPM t-statistic map for the positive market return (rNL+) regressor in the “Not Live” condition showing no activation in the striatum but strong activation in the visual cortex (e). Threshold: p < 1 × 10⁻⁵ (uncorrected); cluster size ≥5. Slices defined by y = 8 and y = −72. Random effects over subjects, n = 54.

