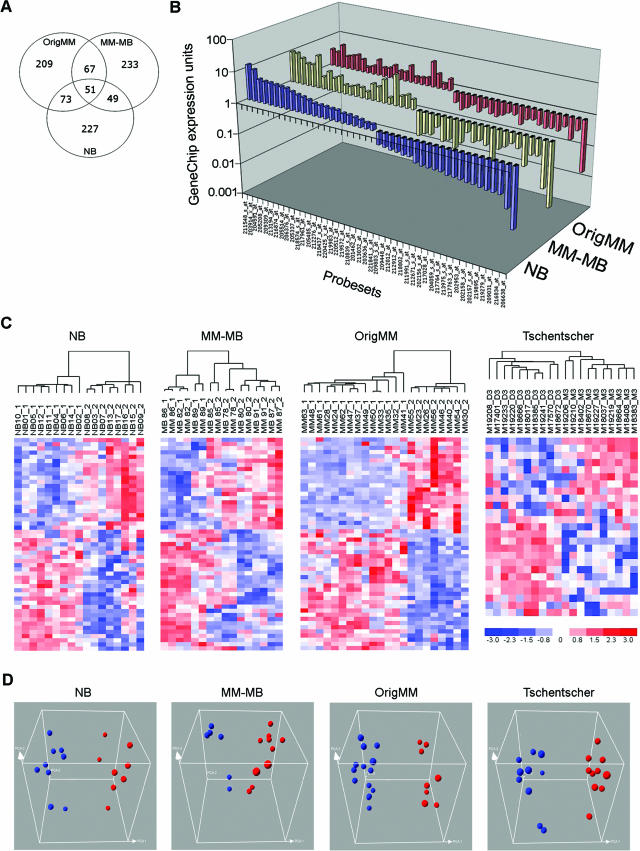
Figure 3.
A: Venn diagram showing concordant probe sets between the NB, MM-MB, and origMM datasets. B: Comparison of GenChip expression units for the 45-probe set list in the indicated datasets. C: Hierarchical clustering and (D) principal component analysis of the indicated datasets using the 45-probe-set list (blue spheres, class 1 tumors; red spheres, class 2 tumors). The two classes indicated in the Tschentscher dataset refer to monosomy versus disomy for chro-mosome 3.

