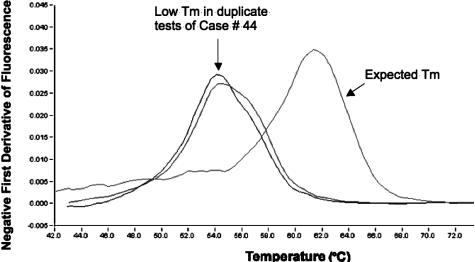
Figure 3.
Melt-curve analysis reveals an abnormal melt temperature (Tm) in duplicate EBV PCR assays on sample 44. This plasma sample was taken from a woman with terminal multiorgan failure following a drug overdose. A typical melt curve on the right has probe dissociation at approximately 61°C, whereas the atypical melt curves on this particular sample have probe dissociation at approximately 54°C.

