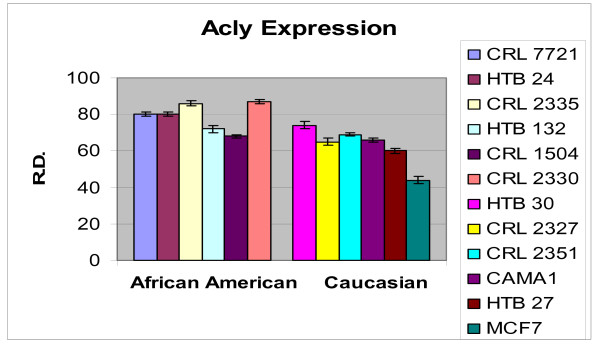
Figure 5.
Densitometric measurement of the Acly RT-PCR analyses. Using the data obtained from the RT-PCR experiments, the amplicons from three different experiments of each cell line was subjected to densitometric scanning. To determine the relative density, area plots were quantitated using the Chemi Imager Tm 4000 software (Alpha Innotect, Corp. San Leandro, CA). Values from the experiments were averaged and error bars represent the standard deviation.

