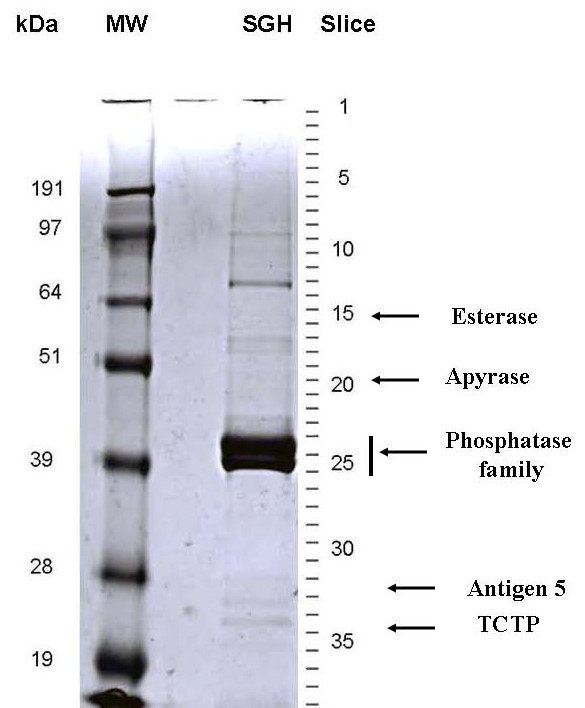
Figure 1.

Gel electrophoresis of Xenopsylla cheopis salivary gland homogenates. The left portion of the gel shows molecular weight markers (MW) in kDaltons. The right portion shows the electrochromatogram of salivary gland homogenates, and the slices that were cut for tryptic digestion MS/MS experiments. The arrows point to the gel slices where the indicated enzymes and translationally controlled tumor protein (TCTP) were found. For more detail, see text.
