
Figure 3.
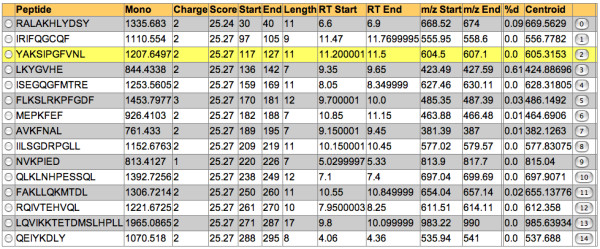
Data Grid. Relevant H/D exchange data for each peptide are presented in the grid view. Selection of the peptide loads the associated data into the main spectral and extracted ion viewers.
Official websites use .gov
A
.gov website belongs to an official
government organization in the United States.
Secure .gov websites use HTTPS
A lock (
) or https:// means you've safely
connected to the .gov website. Share sensitive
information only on official, secure websites.
Data Grid. Relevant H/D exchange data for each peptide are presented in the grid view. Selection of the peptide loads the associated data into the main spectral and extracted ion viewers.