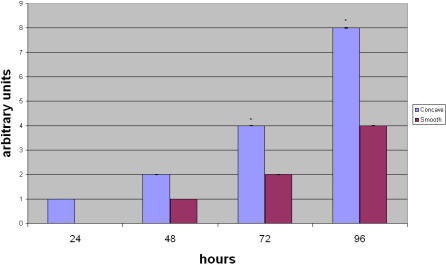
Figure 3. Alkaline phosphatase detection during cell differentiation.
The image shows the quantity of ALP during osteoblast differentiation at 24, 48, 72 and 96 hours within the cells cultured on the different surfaces. The data have been rounded to the closest integer value. The error bars are ±SD.*p<0.01. Each experiment was performed in triplicate (n = 3).

