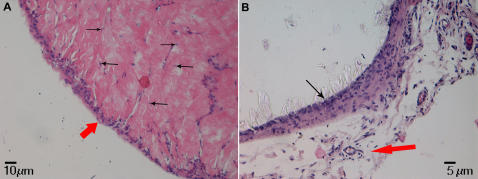
Figure 5. Haematoxilin and Eosin staining.
(A) In vivo sample on concave PLGA scaffold (Calibration Bar = 10 µm). The figures shows that the bone tissue is of great thickness with an evident periosteal layer (red arrow) and containing osteocytes entrapped within the matrix (black arrows). (B) In vivo sample on smooth PLGA scaffold (Calibration Bar = 5 µm) appeared to be more primitive, thin (black arrow) and not as well developed above a connective loose tissue containing vessels (red arrow).

