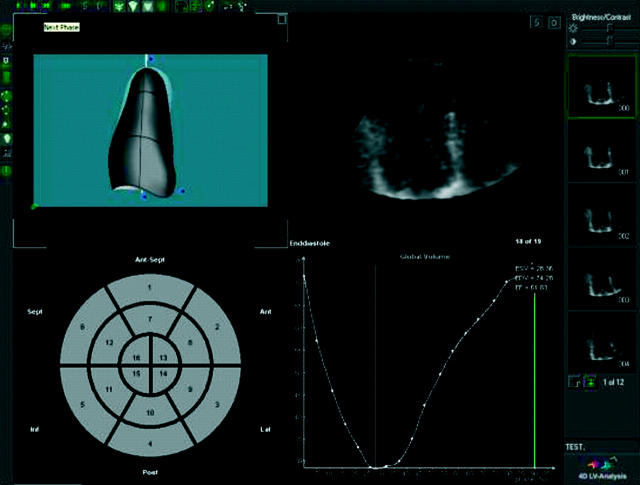
Figure 2.
Three dimensional (3D) echocardiographic evaluation of left ventricular (LV) volumes and ejection fraction. Images from a volumetric dataset are reconstructed (upper centre and right column) and semi-automated edge detection is used to trace the endocardial border and construct a 3D model in systole and diastole (upper left). Expression of volumes in each image yields a time–volume curve (lower left) from which ejection fraction is calculated.

