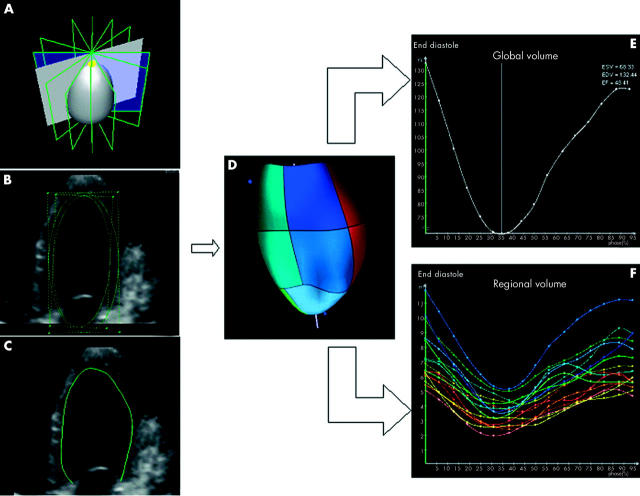
Figure 3.
Panel A depicts the pyramidal volume of data divided automatically into eight equi-angled longitudinal slices through the apex. Panels B and C depict the automated border detection algorithm used to track endocardial borders throughout the cardiac cycle. A dynamic ventricular cast is automatically displayed as a result of the endocardial borders and surface reconstruction (panel D). Global volumes and ejection fraction is displayed in panel E. Regional volumes of all 16 segments are shown in panel F.

