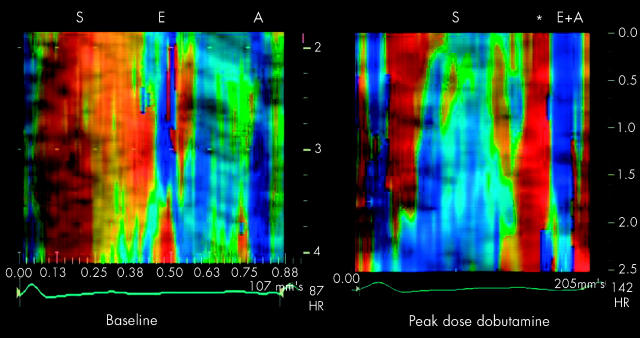
Figure 3.
Colour curved M mode longitudinal strain rate images in the same patient as in fig 2 obtained in the inferobasal segment at baseline and peak dose dobutamine infusion. At baseline, there is negative systolic strain rate (red encoded) showing normal longitudinal shortening. During peak dose dobutamine infusion, there is positive systolic strain rate (blue encoded) showing longitudinal expansion or lengthening. The systolic strip is followed by a red encoded strip (*) occurring after aortic valve closure showing post-systolic shortening, another marker of ischaemia. Curved M mode reconstruction provides a visual analysis of segmental deformation rate of myocardial segments.

