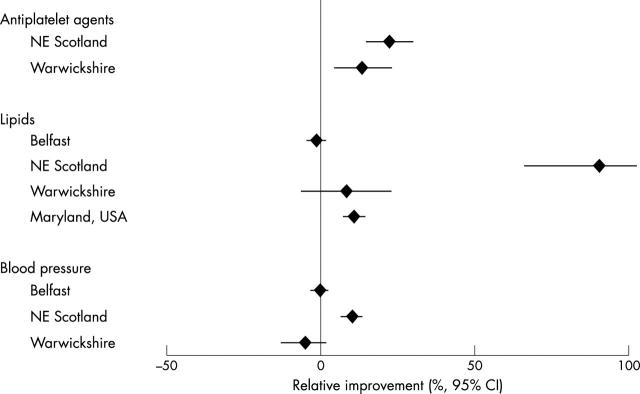
Figure 2 .
Effect of nurse led clinics on drug treatment and risk factors. The figure shows the percentage improvement in the intervention group compared to the control group (mean values for total cholesterol and systolic blood pressure are compared for the Belfast and Maryland studies and proportions on treatment or reaching targets elsewhere).

