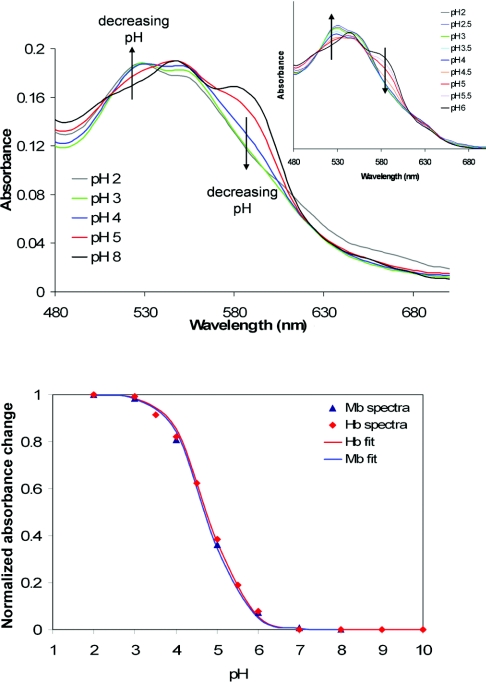
Figure 1. Spectra of ferryl Mb collected at known pH values (upper panel) and normalized pH-dependence of A529−A588 for Mb and Hb (lower panel).
Upper panel: spectra of ferryl Mb collected at known pH values; the corresponding haemoglobin ferryl spectra are shown as an inset. Lower panel: pH-dependence of A529−A588 for Mb and Hb normalized between maximum value (1) and minimum value (0); fits to the Henderson–Hasselbach equation yield pKa values of ∼4.7 for both proteins.

