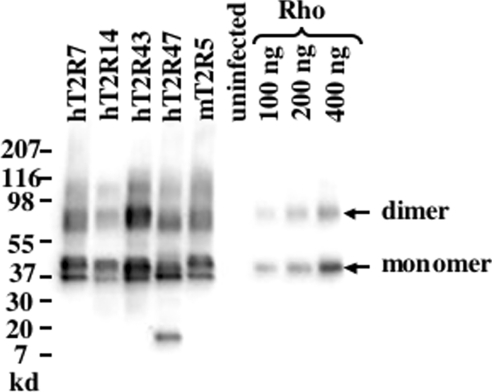
Figure 1. Western blot analysis of T2R expression.
Western blot analyses of urea-washed P2 membranes from uninfected Sf9 cells or cells infected with baculoviruses expressing the Rho-T2R chimeric receptors were performed to examine expression levels. Detection was performed with a monoclonal antibody (B6-30N) that recognizes the N-terminus of bovine rhodopsin. Total membrane protein (3 μg) or 30, 60 or 120 fmol of purified bovine rhodopsin (Rho) was loaded per lane. Electrophoresis and visualization was performed as described in the Experimental section. As is the case for most family 1 GPCRs, including rhodopsin and the expressed T2Rs, polymerization occurs in the presence of SDS resulting in the appearance of bands representing different states of polymerization. The integrated intensities of the monomer and dimer rhodopsin bands were used to establish a calibration curve, and the abundance of each T2R was determined from the regression line. The summated intensities of the various T2R oligomer bands were used to estimate the relative rhodopsin immunoreactivity and abundance of each T2R. Molecular mass markers are indicated.

