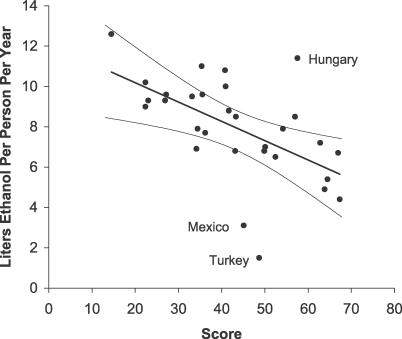
Figure 3. Score versus Alcohol Consumption.
Scatter plot shows the relationship between alcohol policy score and annual per capita alcohol consumption. The regression line has a slope of −0.10 (p = 0.001), signifying a decrease in consumption of 1 l absolute alcohol for each 10-point increase in the score (95% CI 0.4–1.5 l). Arcs show 95% confidence limits. See Discussion for comments about the three identified countries.

