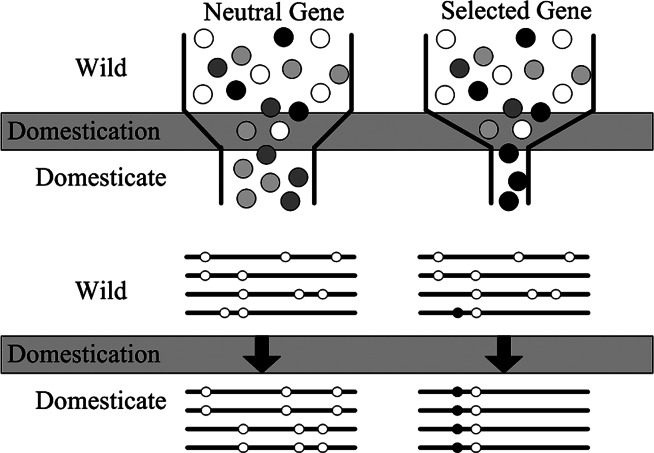
Fig. 2.
Schematic representation of a population bottleneck and its effect on a neutral gene and a selected gene. In Upper, shaded circles represent genetic diversity. The bottleneck reduces diversity in neutral genes, but selection decreases diversity beyond that caused by the bottleneck alone. Lower illustrates sequence haplotypes of these two hypothetical genes. The neutral gene lost several haplotypes through the domestication bottleneck, but the selected gene is left with only one haplotype containing the selected site.

