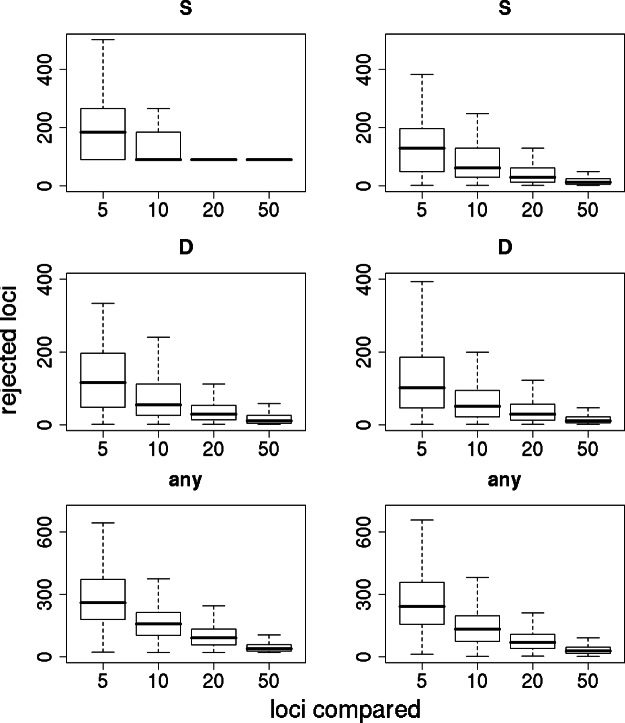
Fig. 3.
Resampling tests to examine empirical ranking methods for finding candidate genes. Left represents sequence data from maize alone; Right demonstrates the difference in statistics between maize and teosinte. The statistics are the number of SNPs (S) (Top), Tajima's D (Middle), and a combination of both (Bottom) (see text). For each graph, the heavy line represents the median number of genes, of ≈800, that are inferred to be under selection. Boxes represent the central 50% of the data, and lines extend out to 3/2 of the interquantile range.

