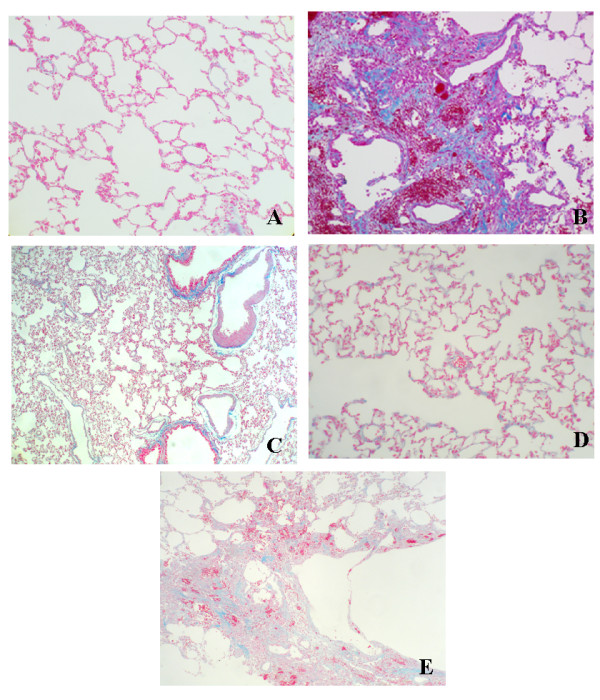
Figure 5.

Azan staining of lung tissue from each group. (A) Azan staining of the saline group shows minimal collagen content in the lung parenchyma; 100×. (B) Azan staining of the Bleo group shows an increase in the collagen content of lung parenchyma; 100×. (C) Azan staining the Bleo+AS group shows a reduction in collagen fibrils compared to the saline and Bleo groups; 100×. (D) Azan staining the AS group shows minimal collagen in the lung parenchyma; 100×. (E) Azan staining of the Bleo+S group shows an increase in the collagen content of lung parenchyma, comparable to the Bleo group; 100×.
