Figure 7.

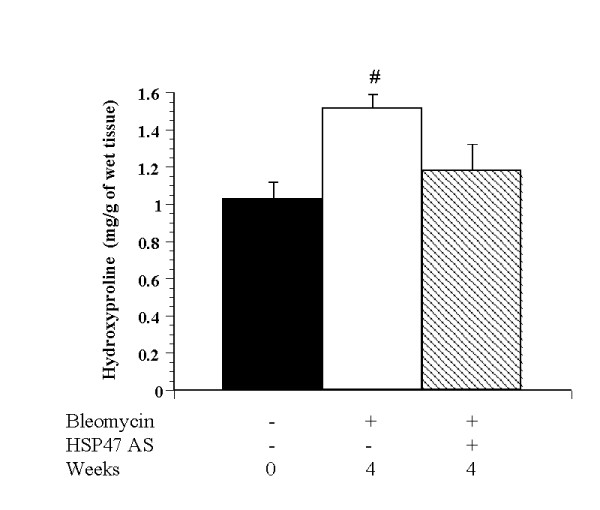
Hydroxyproline content of lung tissues (mg/g of wet tissue) at 28 days post Bleo injection. Comparison between control, Bleo, and Bleo+AS groups (n = 8). Data are expressed as the means ± SEM. # p < 0.05 vs. control group.

Hydroxyproline content of lung tissues (mg/g of wet tissue) at 28 days post Bleo injection. Comparison between control, Bleo, and Bleo+AS groups (n = 8). Data are expressed as the means ± SEM. # p < 0.05 vs. control group.