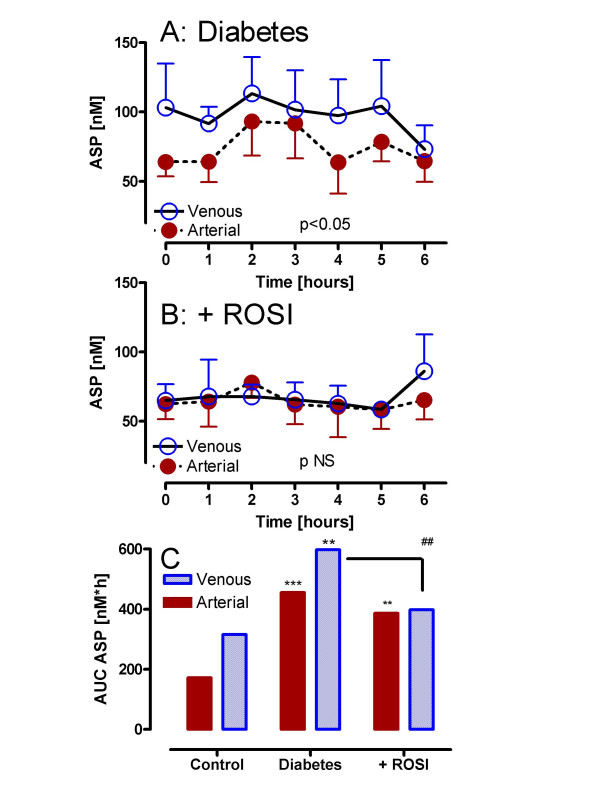
Figure 5.
ROSI decreases ASP production in diabetic subjects: Following a standardized mixed meal, arterial and adipose venous ASP were measured serially from 0 to 6 hours in diabetics (A: n = 6) and diabetics treated with rosiglitazone (B: n = 6 ROSI). Results are expressed as average ± sem where the statistical comparison of venous vs. arterial for each group is provided within the graph (using RM-ANOVA). Detailed statistics comparing groups are presented in the text. In Panel C, results are given for calculated total area-under-the-curve (AUC) for ASP in control, diabetics and diabetics treated with ROSI, where ** p < 0.01 and *** p < 0.001 vs. the matched arterial or adipose venous control, ## p < 0.01 ROSI treatment vs. untreated diabetics.

