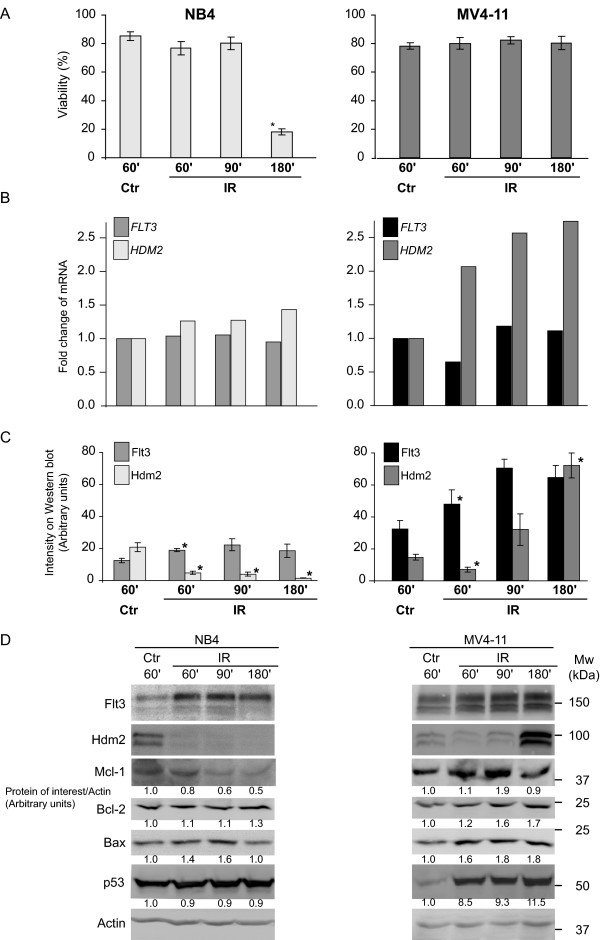
Figure 1.
Rapid IR-induced protein modulation of Flt3, Hdm2 and Bcl-2 family members in AML cell lines. A. Cells were exposed to 25 Gy and fixed after the indicated time (minutes). The percentage of normal nuclei in a total of 200 cells was determined in Hoechst stained cells for each time point. The results shown represent the mean of three separate experiments and the error bars show standard error of mean (SEM = Standard Deviation/√n). The star denotes statistical significance relative to the control, this is determined by a Students two-tailed t-test, p < 0.05. B. mRNA level of FLT3 and HDM2 was determined by Real-time PCR in one typical experiment. GAPDH was used as endogenous control. C. IR down regulated Hdm2 protein and up regulated Flt3 protein in these AML cell lines. The diagram shows measured intensity on three separate Western blots (normalized to Actin). The error bars show standard error of mean SEM and the stars represents significance as in A. D. Visualization of the protein modulations of Flt2 and Hdm2 shown in C. in addition to modulation of proteins in the Bcl-2 family. Mean intensity on the Western blots written below the corresponding panel were measured and normalized to Actin and to the control. The values shown are arbitrary units and represent one typical experiment.

