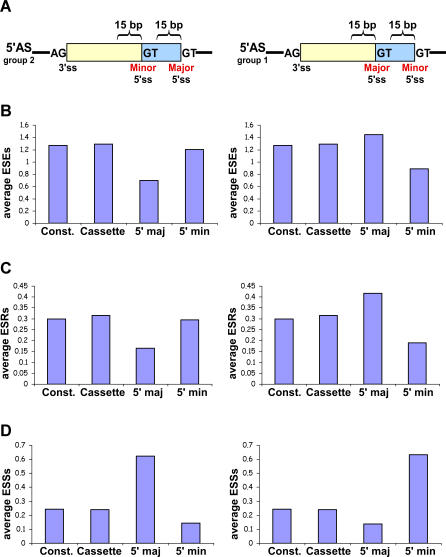
Figure 2. ESRs Analysis of Human–Mouse Conserved Alternative 5′ss Events.
A region 15 bp upstream of the major (5′ maj) and minor (5′ min) 5′ss was screened for ESRs. Average ESR number was calculated for each region. The analysis was performed for human–mouse conserved 5′ alternative splicing events that were divided into two subgroups according to their major/minor forms and the results were compared with constitutive (Const.) and alternative cassette conserved exons. Left and right panels are “group 2” (major form is longer than minor form) and “group 1” (major form is shorter than minor form) A5Es, respectively.
(A) Schematic illustration of the analysis conducted.
(B) Average ESEs [36].
(C) Average ESRs [10].
(D) Average ESSs [37].

