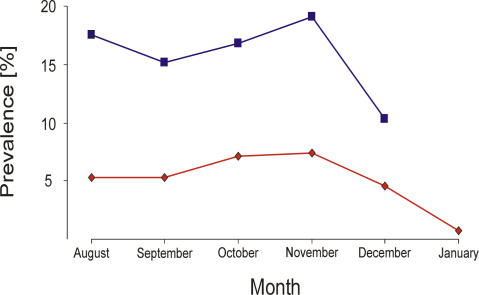
Figure 4. Trend Lines for Influenza A Virus Prevalence in Mallards Caught in Sweden and The Netherlands during Fall Migration.
The blue line and filled squares (▪) represent the proportion (%) of influenza A virus positive mallards caught and sampled in Sweden between 2002 and 2005 at Ottenby Bird Observatory. The red line and filled diamonds (♦) represent mallards caught at various locations in The Netherlands from 1998 to 2005.

