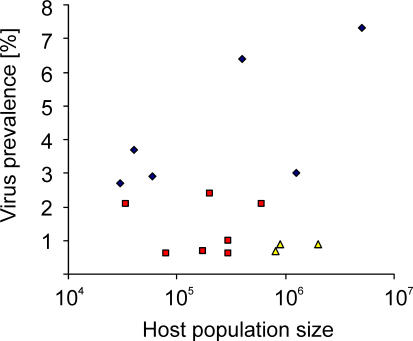
Figure 5. Relation between Influenza A Virus Prevalence in Avian Hosts and Their Population Sizes.
Species were categorized in dabbling ducks (blue diamonds; mallard [population 5,000,000; prevalence 7.3%], Eurasian wigeon [1,250,000; 3%], common teal [400,000; 6.4%], northern pintail [60,000; 2.9%], gadwall [30,000; 2.7%], and northern shoveler [40,000; 3.7%]); geese (red squares; white-fronted goose [600,000; 2.1%], barnacle goose [176,000; 0.7%], greylag goose [200,000; 2.4%], brent goose [300,000; 1%], bean goose [80,000; 0.6%], and pink-footed goose [34,000; 2.1%]); and gulls (yellow triangles; black-headed gull [2,000,000, 0.9%], common gull [500,000, 0.9%], and herring gull [800,000, 0.7%]). Virus prevalence in these species was plotted against their respective population sizes [26]. Species are included if >200 samples were tested for influenza A virus. There was no correlation between influenza A virus prevalence and population size, but there was a clustering of data points according to the species categories.

