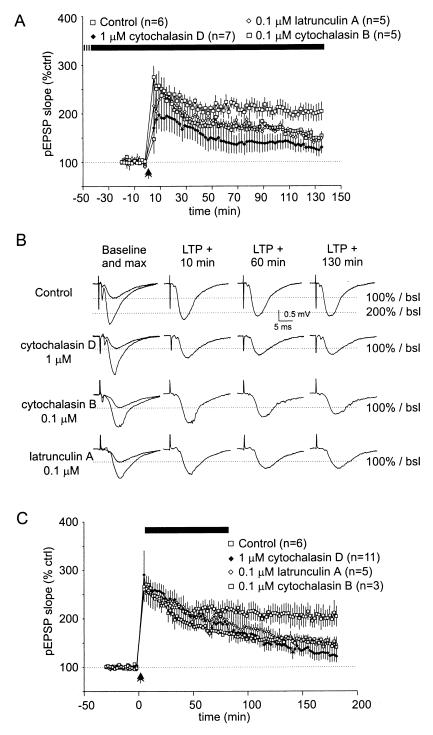
Figure 3.
AAIs selectively reduce LTP maintenance. (A and B) After superfusion of AAIs for at least 40 min, LTP was induced and responses recorded for 135 min. (A) Although cytochalasin D (1 μM, n = 4; 0.1 μM, n = 3; data pooled) seemed to reduce PTP compared with untreated (control) slices, these changes were not significant for the first 20 min after LTP induction. After a short potentiation to about 200% of baseline after 10 min, the pEPSP slope declined steadily to reach a plateau of about 140% after 60 min of LTP induction. Cytochalasin B also reduced PTP, although not significantly; responses were potentiated after 10 min to values similar to those in untreated slices but declined steadily afterward and reached 150% of baseline after 130 min of LTP induction. Like cytochalasin B, latrunculin A reduced PTP slightly; responses were potentiated for 10 min and declined to about 150% of baseline after 130 min of LTP induction. (B) Representative traces taken during baseline recording (maximal and 30–50% of maximal amplitude), 10, 60, and 130 min after LTP induction. (C) Maintenance of LTP is blocked selectively by AAIs. After recording control responses for at least 30 min, LTP was induced. Immediately afterward, AAIs were superfused for 60–80 min while recording continued. Cytochalasin D (1 μM, n = 7; 0.1 μM, n = 4; data pooled), cytochalasin B, and latrunculin A did not alter PTP but reduced LTP magnitude significantly, as measured at 120 and 180 min after LTP induction (pEPSP slope measurements). The dotted lines mark baseline (100%) amplitude.

