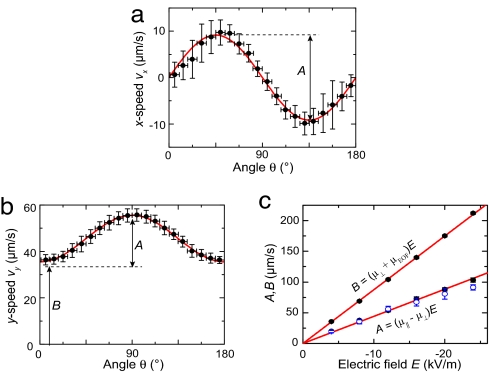
Fig. 3.
Electrophoresis. (a) Measured vx as function of orientation θ at E = −4 kV/m (mean ± standard deviation of 9° bins, n = 4,570). The solid line is a fit to Eq. 8. (b) θ-dependent vy (same E), with a fit to Eq. 9. (c) Fitted values of B (from b) and A (from a and b) as function of E. From the fits, we find (μ‖ − μ⊥) = (−4.42 ± 0.12) × 10−9 m2/Vs, and (μ⊥ + μEOF) = (−8.75 ± 0.04) × 10−9 m2/Vs.

