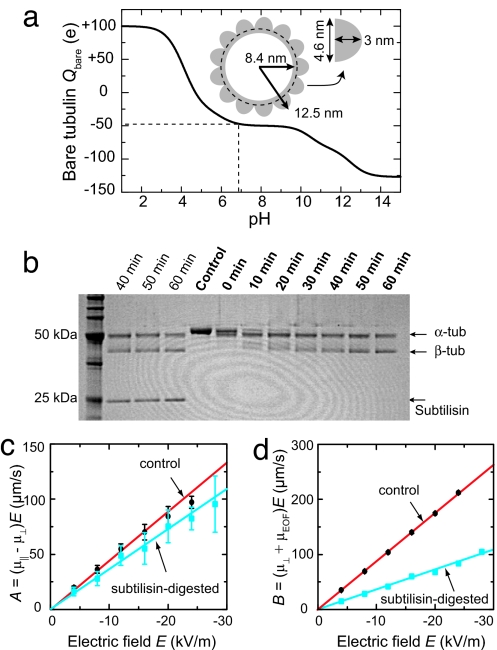
Fig. 6.
Tubulin digestion. (a) Calculated Qbare per dimer from sequence data. At pH 6.9, the calculated Qbare is −47 e per dimer. (Inset) Cross-section dimensions of a microtubule constructed from an axial projection of the microtubule electron-density map (20). The 13 protofilaments are displayed as half-ellipsoids of 4.6 nm width and 3.0 nm height, around a 1.1-nm-thick cylinder of inner radius of 8.4 nm. (b) Denaturing SDS/PAGE of digested microtubules. “Control” shows untreated centrifuged microtubules in a single band. The subsequent lanes show the results for subtilisin-treated microtubules for different digestion times, obtained after centrifugation. Subtilisin is present at the 25-kDa band before centrifugation (first three lanes). (c) Amplitude of measured vx(θ) and vy(θ) of digested microtubules as function of E. “Control” is from Fig. 3c for undigested microtubules. (d) Offset of measured vy(θ) of digested microtubules for different Es.

