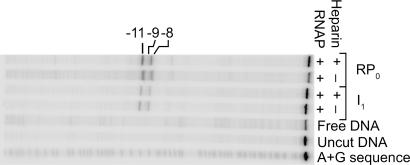
Fig. 2.
Potassium permanganate (KMnO4) footprints of RNAP–promoter complexes. Shown are representative results from KMnO4 probing of complexes obtained early (20 sec, >70% I1, <30% RPo) and late (>2,500 sec, <5% I1, >95% RPo) in the time course of open complex formation at 17°C. G+A sequencing (40) and an uncut DNA control were performed. Positions of KMnO4-reactive thymines in RPo on the template strand are labeled. KMnO4 reactivity observed in the 20 sec lanes in the presence and absence of heparin is consistent with the small population of RPo complexes formed at this time after mixing. SI Table 3 quantifies the intensity of bands in this and two other independent experiments. See SI Fig. 7 and SI Table 3 for KMnO4 probing of the nontemplate strand.

