Fig. 1.
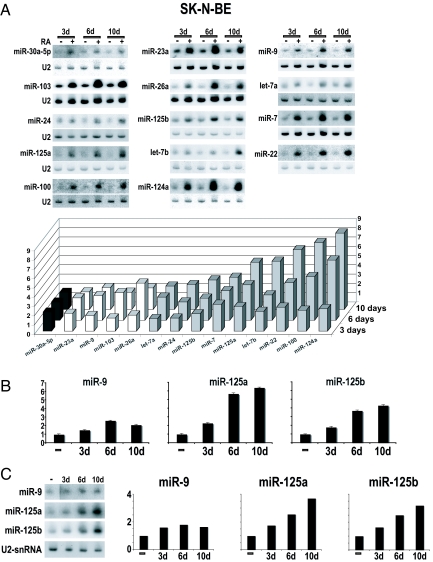
Expression profiles of miRNAs up-regulated in RA-treated SK-N-BE cells. (A) (Upper) Northern blots of the 14 miRNAs up-regulated in SK-N-BE cells upon RA treatment for 3 (lane 3d), 6 (lane 6d), or 10 (lane 10d) days. The probes are indicated on the left side of each panel; data were normalized to U2 snRNA hybridization signals. (Lower) The histogram depicts the distribution of the subsets of the 14 up-regulated miRNAs, clustered on the basis of their maximum induction times. Fold changes in miRNA expression are shown as the mean of the ratio of the RNA levels in RA-treated vs. untreated cells from three independent experiments. (B) RT-PCR quantification of miR-9, miR-125a, and miR-125b expression in SK-N-BE cells upon RA treatment for 3 (3d), 6 (6d), or 10 (10d) days. (C) Northern blots and histograms illustrating miRNA induction in KCNR NB cells, treated with RA for the same time points described in A and B. In B and C fold changes in miRNA expression are reported as the ratio of the RNA levels in RA-treated vs. untreated cells.

