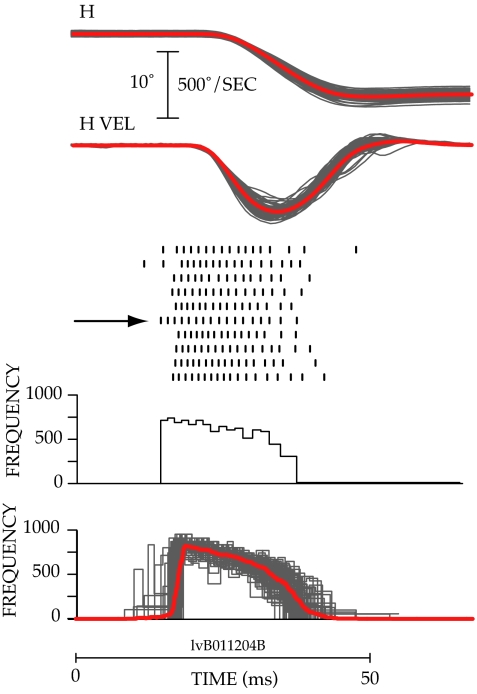
Fig. 1.
Variability in eye position, eye velocity, and spike frequency during 76 saccades to the same target. (Top) Changes in horizontal position (H) and horizontal velocity (HVEL) observed during 76 saccades made to a target presented 10° to the left of a central fixation target are plotted by thin gray lines. The averages of the position and velocity traces are shown by bold red lines. (Middle) Raster plots of spike occurrence are shown for 10 of the 76 movements below the velocity traces. Each tick mark indicates the time of occurrence of an action potential. Each row shows the action potentials recorded during a single movement, and the horizontal arrow marks the burst for which the instantaneous frequency plot was constructed. (Bottom) A plot of the instantaneous frequency firing rate (reciprocal of ISI × 1,000) of the cell during the burst indicated by the horizontal arrow is shown below the rasters. Instantaneous frequency plots for all 76 trials are superimposed at the bottom, and the average is shown by the bold red line.

