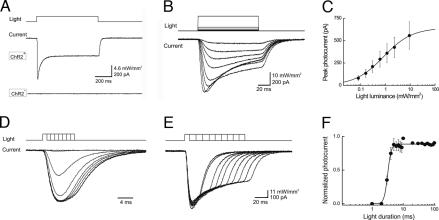
Fig. 2.
Illumination evokes photocurrents in ChR2-positive cortical neurons. (A) Prolonged light flash (top trace) generated a photocurrent (middle trace) in a neuron that expressed ChR2. No photocurrent was observed in a ChR2-negative neuron from a wild-type mouse (bottom trace). (B) The peak amplitude of photocurrents (lower trace) increased as a function of light intensity (upper trace). (C) Relationship between photocurrent amplitude and light intensity (100-ms duration); points indicate means ± SEM for seven neurons. Curve is a fit of the Hill equation. (D and E) Photocurrent (bottom traces) varied with light duration (top traces). (D) Responses to brief light pulses (1- to 8-ms durations). (E) Responses to longer duration flashes (10- to 100-ms durations). (F) Relationship between photocurrent amplitude and photostimulus duration (9.2 mW/mm2 luminance). Curve is fit of the Hill equation.

