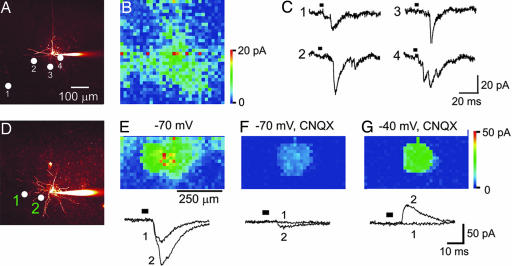
Fig. 6.
Properties of cortical microcircuits. (A) Fluorescence image of dye-filled layer VI pyramidal neuron. (B) Map of synaptic circuit innervating the pyramidal neuron shown in A. (C) Traces indicate excitatory postsynaptic currents (holding potential = −70 mV) measured when the light spot was positioned at the indicated locations in A. (D) Fluorescence image of dye-filled layer VI pyramidal neuron; circles indicate locations where light-evoked synaptic responses shown at the bottom of E were evoked. (E) Map of excitatory synaptic inputs innervating the neuron shown in D. Traces below the map indicate excitatory postsynaptic currents, measured at a holding potential of −70 mV, when the light spot was positioned at the locations indicated in D. (F) Treatment with 10 μM CNQX almost completely blocked the responses measured at −70 mV (compare with E), indicating that the responses in E are largely glutamatergic excitatory postsynaptic currents. (G) Same conditions as in (E) except that the postsynaptic membrane potential was changed to −40 mV, to reveal outward IPSCs (traces below). Comparison of E with G shows that inhibitory and excitatory inputs have different spatial distributions on the same cell. Bars in C and E–G indicate time of illumination.

