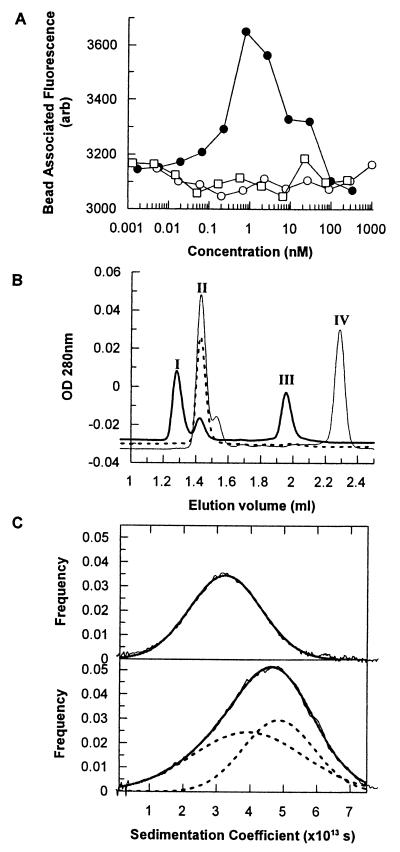
Figure 4.
Biochemical evidence of AF18748-induced IL-5Rα dimerization. (A) Microvolume fluorimetry. Fluorescently labeled IL-5Rα ECD was incubated with IL-5Rα ECD-coated polystyrene beads and serial dilutions of AF18748 (●), AF17121 (○), or human IL-5 (□). Binding reactions were incubated in microtiter plates overnight at room temperature, and the bead-associated fluorescence was determined by using an FMAT instrument (Perkin–Elmer). Data points represent averages of triplicate determinations from a single representative experiment. (B) Gel filtration chromatography. IL-5Rα ECD was loaded onto a Precision Superdex 200 3.2/30 column alone (dotted line) or in the presence of equimolar amounts of AF17121 (light line) or AF18748 (dark line). Peak I corresponds to free AF17121 (2.5 kDa), peak II to free AF18748 (3.9 kDa), peak III is where monomeric IL-5R ECD elutes (89.5 kDa), and peak IV corresponds to a molecular mass of 209 kDa. Results shown are from a single experiment, representative of three separate runs for each condition. (C) Analytical ultracentrifugation. IL-5Rα ECD was examined alone (Upper) or in the presence of equimolar amounts of AF18748 in both reference and sample compartments (Lower). Data were analyzed by using both ultrascan and dcdt. Data are shown as the distribution of species observed, overlaid with curves fitted to a Gaussian distribution (Upper) or two overlapping Gaussian distributions (Lower). Data shown are from a single experiment representative of three.

