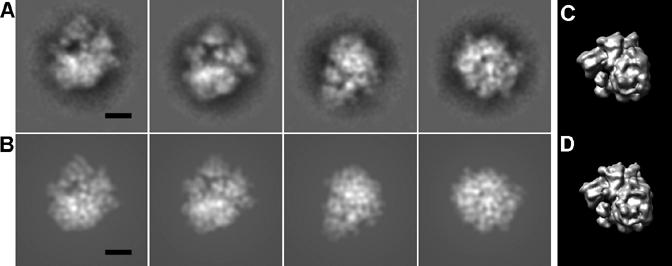
Fig. 3.

Test using the ribosome data set. (A) Four class averages of difference images that have the highest FSCs. (B) Projections of the atomic structure calculated to 20 Å resolution with orientations corresponding to (A). (C) 3D reconstruction of the ribosome core using the difference images. (D) The structure of ribosome calculated to 25 Å resolution in the same orientation as (C). The scale bar represents 100 Å.
