
Figure 1. A and E Sites in the Pol II Transcribing Complex (A).
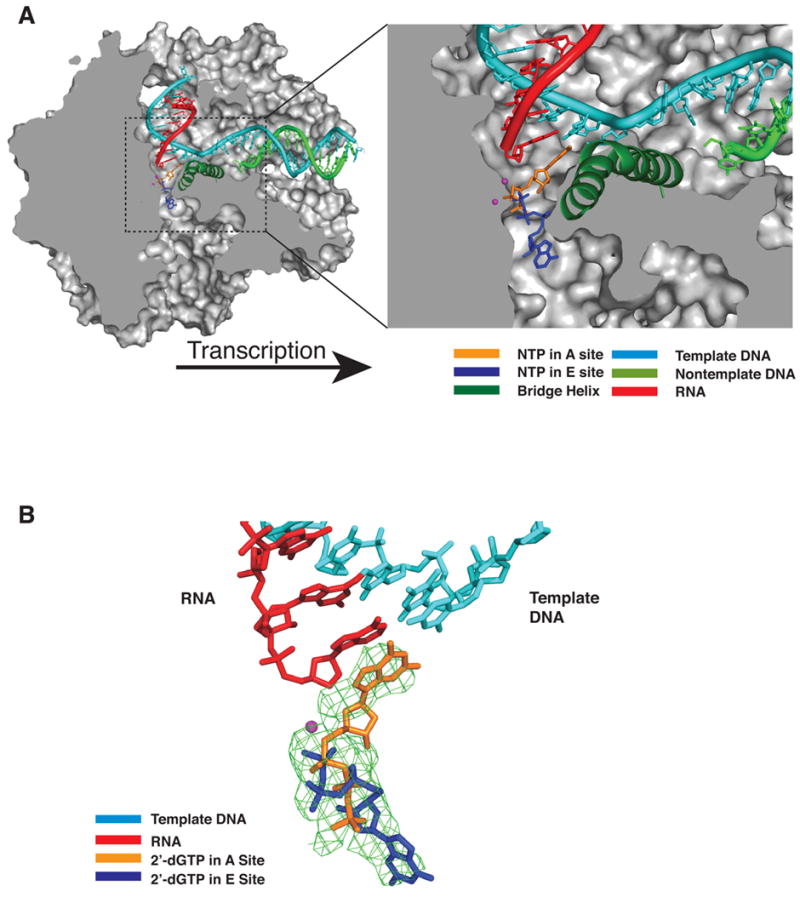
Cutaway view of the pol II transcribing complex. Template DNA, non-template DNA, RNA, GTP in the A site, and ATP in the E site are shown in cyan, green, red, orange, and blue, respectively. The bridge helix (Rpb1 815–848) is in green and Mg2+ ions are shown as magenta spheres. The pol II surface is shown in gray (Westover et al., 2004).
(B) Difference electron density map for transcribing complex crystals soaked with 2’-dGTP. An Fo-Fc omit map contoured at 3.0 sigma is shown in green mesh. Template DNA, RNA, 2’-dGTP (A site) and 2’-dGTP (E site) are shown in cyan, red, orange, and blue, respectively.