
Figure 3. Trigger Loop Interactions and Nucleotide Selectivity.
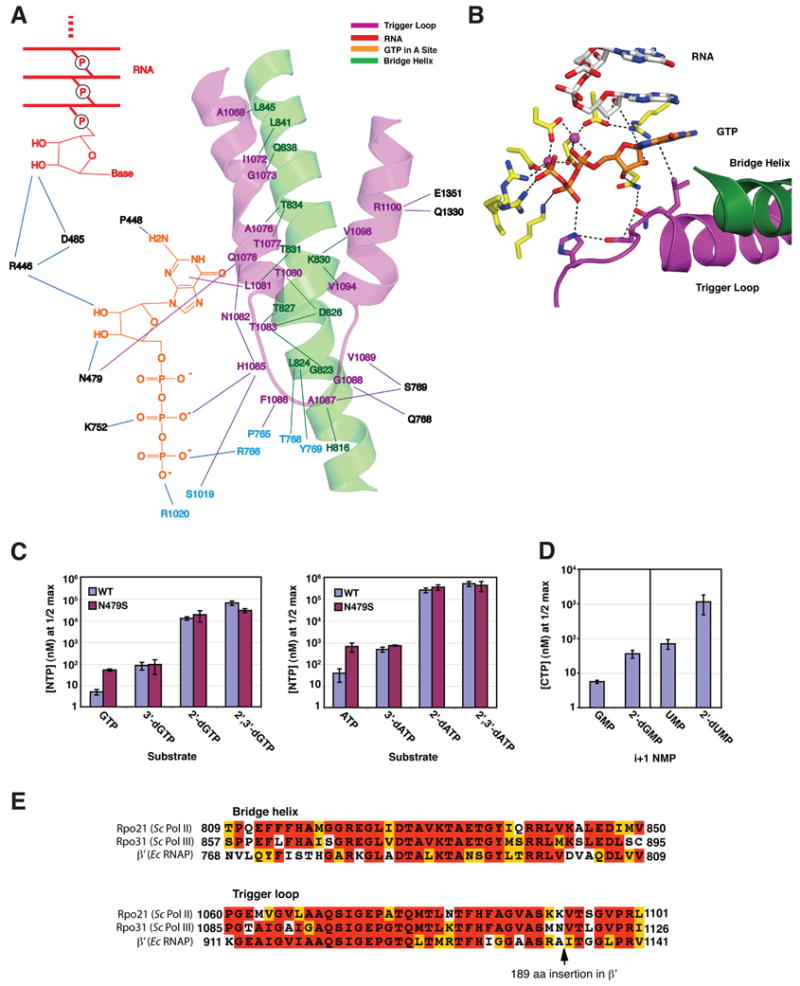
(A) The trigger loop network. Trigger loop and bridge helix are magenta and green, GTP is orange, and the 3’end of the RNA is red. Other residues of Rpb1 and Rpb2 are indicated in black and cyan.
(B) Interactions with GTP in the A site. Trigger loop and bridge helix are magenta and green, GTP is orange, and the 3’-end of the RNA is white, except oxygen and nitrogen atoms are highlighted in red and blue. Other residues of Rpb1 and Rpb2 are shown in yellow.
(C) Role of Rpb1 Asn479 in selection of the ribose sugar: addition of GTP, ATP and derivatives. Transcribing complexes were formed with wild type and Rpb1 N479S pol II as described for crystallography, with templates specifying addition of either G or A, except with a 9 rather than a 10-residue RNA, which was extended to 10 residues with 32P-radiolabeled NTP. After removal of unincorporated label, complexes were challenged with increasing amounts of template-specified NTP or dNTP derivatives and extension to 11 residues was measured after 5 min (Supplementary Figure 3A). These data were plotted and non-linear regression was performed to determine maximal incorporation of each substrate and the concentration that gave 50% maximal incorporation (apparent KM, Supplementary Figure 3B). Apparent KM values for incorporation of GTP and ATP derivatives by wild type and Rpb1 N479S pol II are shown in the bar graphs. Error bars represent mean +/− standard deviation of at least four apparent KM determinations.
(D) Diminished rate of nucleotide addition following incorporation of 2’-dNMP. Apparent KM values for addition of CTP subsequent to incorporation of either GMP, 2’-dGMP, UMP or 2’-dUMP by wild type pol II elongation complexes are shown. Representative gels and data plots are shown in Supplementary Figure 3C,D. Error bars represent mean +/− standard deviation of eight apparent KM determinations.
(E) Conservation of bridge helix and trigger loop residues. The sequences of bridge helix and trigger loop from S.cerevisiae Pol II, Pol III (Sc) and E. coli RNA polymerase (Ec RNAP) were aligned using MUSCLE (Edgar, 2004) and then adjusted by hand to account for the 189 aa insertion in E. coli RNAP. Alignment was colored for conservation in MACBOXSHADE.