
Figure 4. Three Mg2+ Ion Sites and Binding of GMPCPP in Pol II Transcribing Complexes.
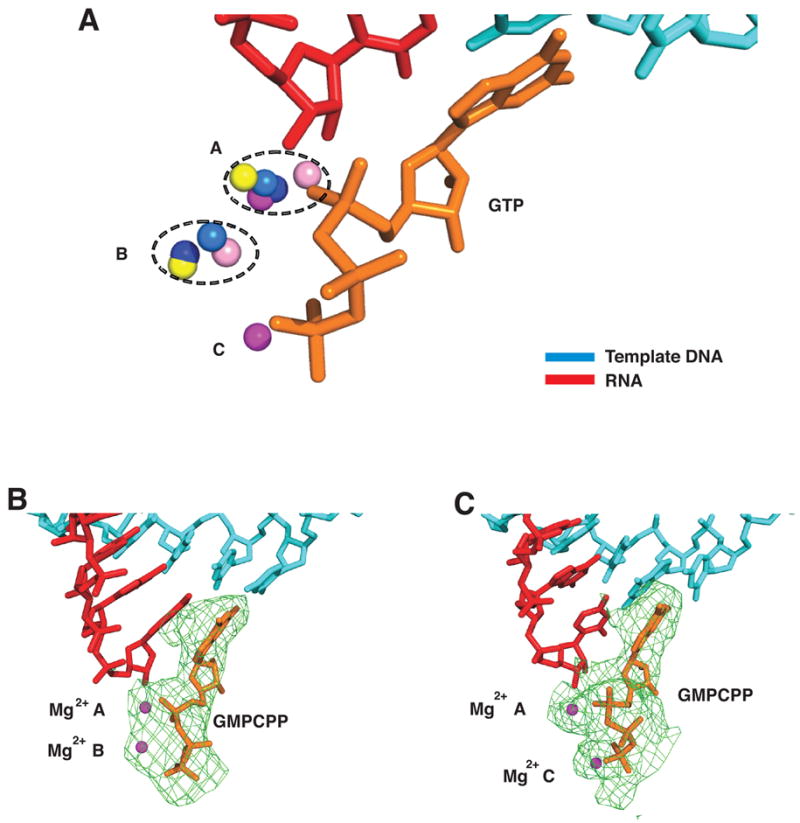
(A) Three Mg2+ ion sites in pol II transcribing complexes. Structures of five pol II transcribing complexes were aligned on phosphates of template DNA and RNA in the active site region. Template DNA, RNA, and GMPCPP at high Mg2+ concentration are cyan, red, and orange, respectively. Mg2+ ions from transcribing complexes (structure, Mg2+ concentration in parentheses) with ATP in the E site (1R9T, low), UTP in the A site (1R9S, low), GTP (Table 1, low), GMPCPP (Table 1, low) and GMPCPP (Table 1, high) are depicted as salmon, blue, yellow, marine, and magenta spheres, respectively. The average distance between metals A and B, B and C, and A and C are 4.0, 4.2, and 5.5 Å, respectively.
(B) GMPCPP (orange) in the A site at low Mg2+ concentration. Color code as in Figure 1B.
(C) GMPCPP (orange) in the A site at high Mg2+ concentration. Color code as in Figure 1B.