Figure 3.


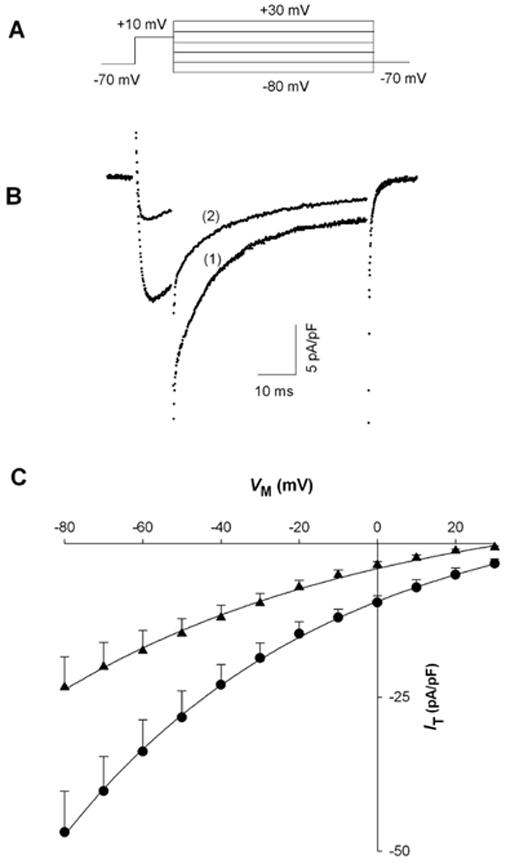
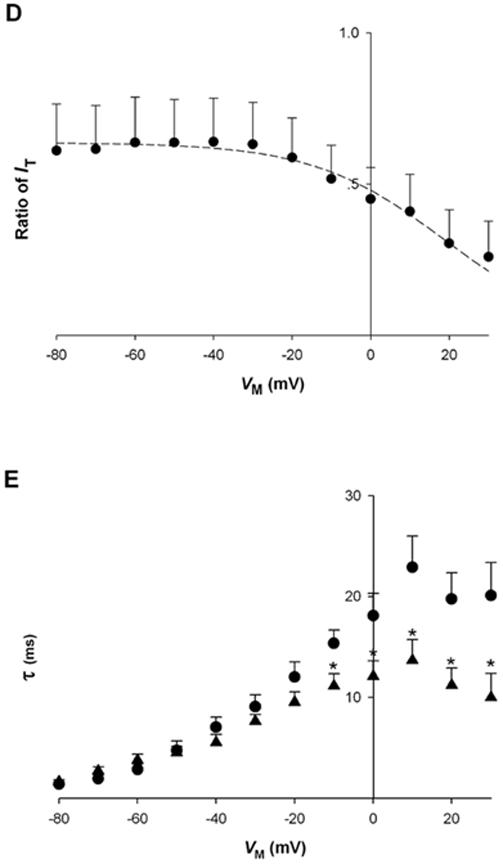
Effect of [Mg2+]p on L-type calcium channel tail currents (IT).A, voltage protocol used to measure instantaneous IT-VM relationships. B, sample records of IT in cardiac myocytes dialyzed with 0.2 mM (1) and 1.8 mM [Mg2+]p (2) at a test potential of -20 mV. IT was recorded in the presence of 0.1 μM BayK8644, 5 min after establishing the whole-cell patch-clamp. C, instantaneous IT-VM relationships in cells dialyzed with 0.2 mM (●, n=5) and 1.8 mM [Mg2+]p (▲ , n=5). D, the ratio of IT, defined as peak IT recorded with 1.8 mM [Mg2+]p at one VM divided by that with 0.2 mM [Mg2+]p, is plotted against VM (n=5). The dashed curve was fit to the data with an arbitrary function. E, time constant of IT decay ( τ) plotted against VM for myocytes dialyzed with 0.2 mM (● , n=5) and 1.8 mM [Mg2+]p (▲ , n=5). Time constants were determined by fitting the change in current during the 50 msec test pulse at each VM without accounting for current levels observed in the presence of 200 M CdCl2. Asterisks indicate significant changes of τ between 0.2 and 1.8 mM [Mg2+]p.
