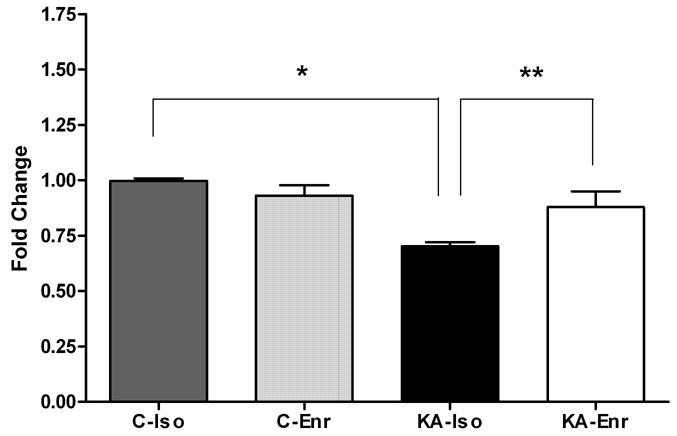
Figure 1. Htr5b microarray data.

Signal intensities of each probe sets from the four groups were normalized against the median value in the C-Iso to calculate the fold changes. Htr5b expression in the hippocampus was significantly lower in KA-Iso compared to C-Iso (* q<0.02) and to KA-Enr (**q<0.01).
