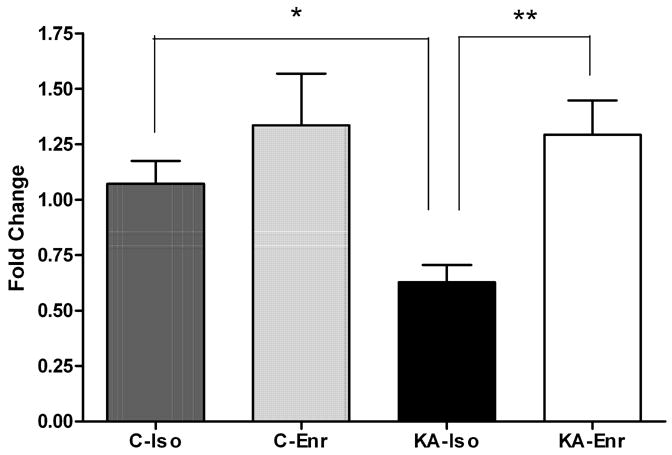
Figure 2. Validation of microarray data by qRT-PCR.

Real time qRT-PCR results confirms the expression level trends seen in the microarray analysis for Htr5b. Htr5b expression in the hippocampus was significantly lower in KA-Iso compared to C-Iso (*p<0.05) and to KA-Enr (**p<0.05), one-way ANOVA Tukey’s Multiple Comparison Test, n=48.
