
Figure 2.
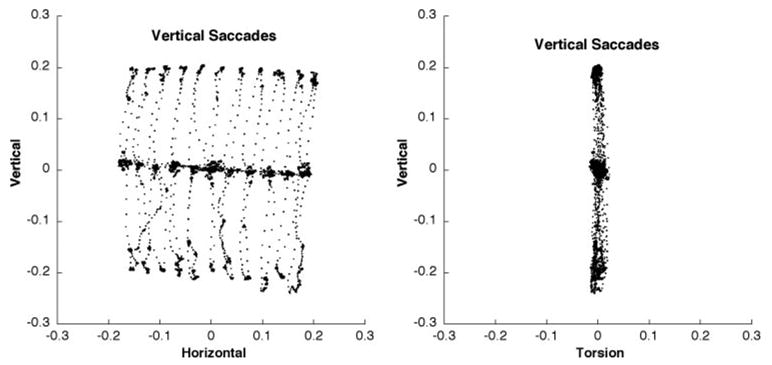
Listing’s plane defined during ± 20° vertical saccades over a ± 20° range of horizontal positions. Data are plotted in quaternions (similar to rotation vectors) that were rotated into Listing’s coordinates so that the thickness of the plane can be easily visualized. Horizontal and vertical offsets have been subtracted for clarity.