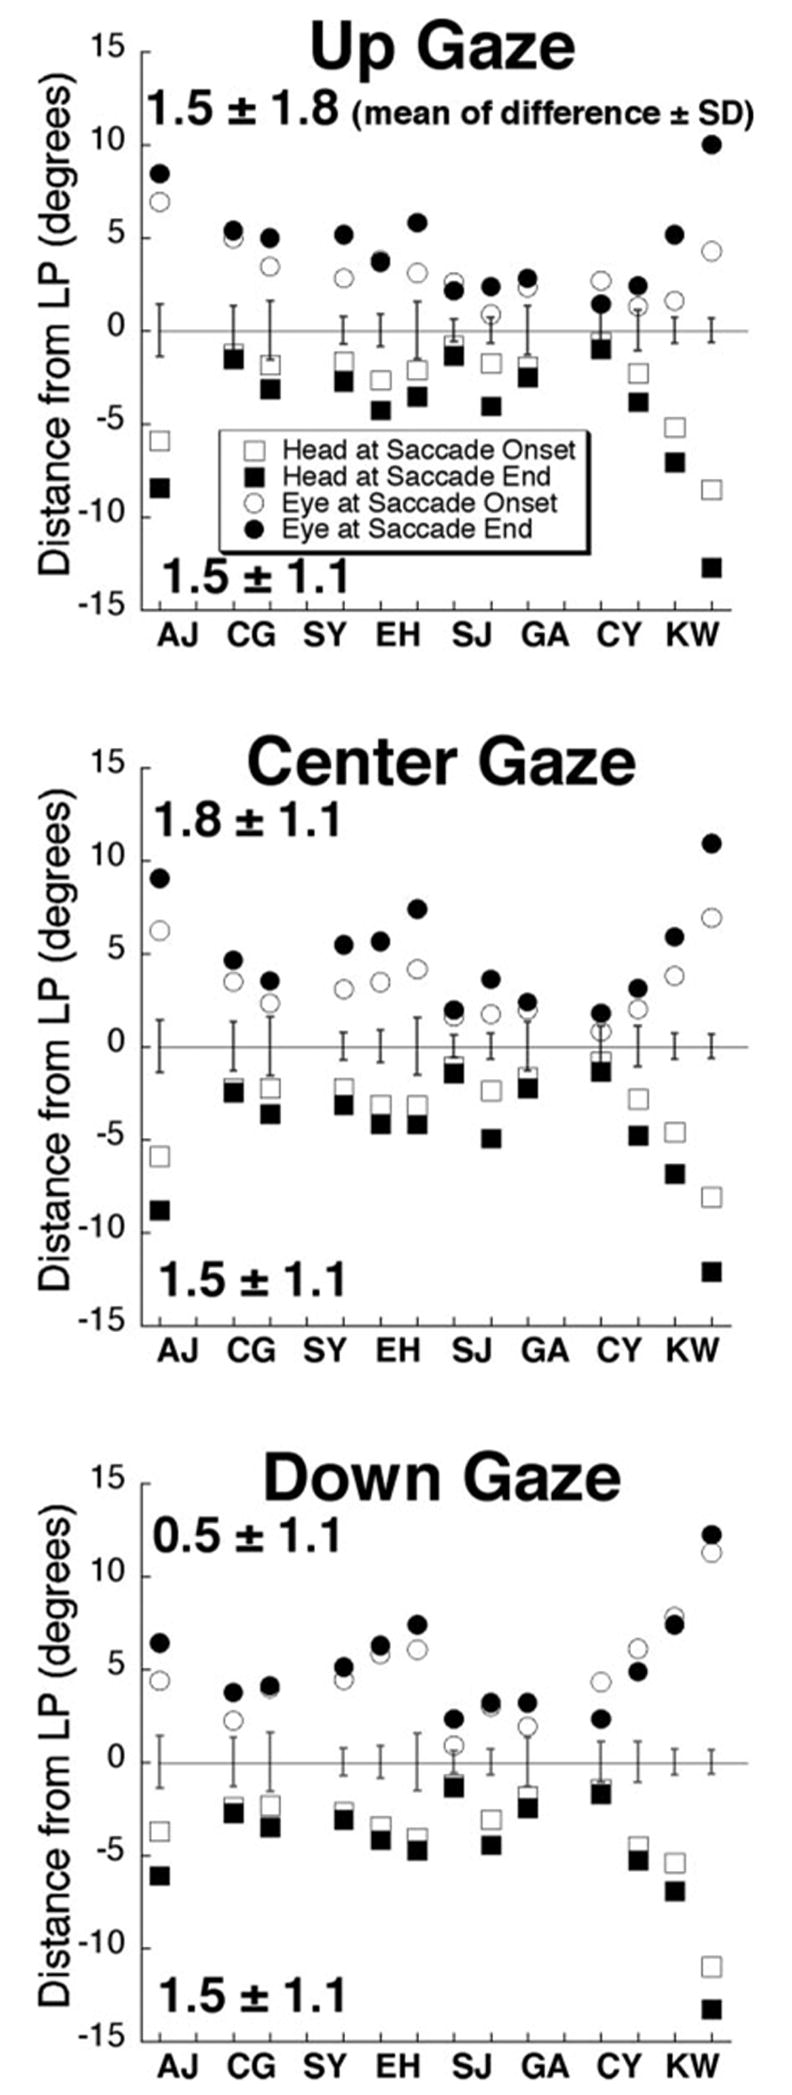
Figure 5.

Mean distance of eye (plotted positive) and head (plotted negative) from LP at the onset and end of vertical saccades executed during the horizontal VOR for three vertical starting positions: ~20° up, center, and ~20° down. Two-letter codes designate individual subjects with data presented for both eyes when available. Data are plotted relative to LP determined with the head stationary in space-fixed coordinates so that the head torsion stimulus to the VOR can be easily assessed. Open symbols: the distance from LP of eye (circles) and head (squares) at saccade onset. Filled symbols: distance of the eye and head from LP at saccade end. Mean and SD values denote increase in distance of eye and head from LP during saccade. Two major factors contributed to variability in distance of eye and head from LP: saccade timing was deliberately varied relative to VOR onset, and LP orientation naturally varied relative to head rotation axis. More extreme values, such as in subjects AJ and KW due to more tilted orientation of LP. Error bars: LP thickness (± 1 SD of torsion in degrees). Head positions are shown as negative values for clarity.
