
Figure 6.
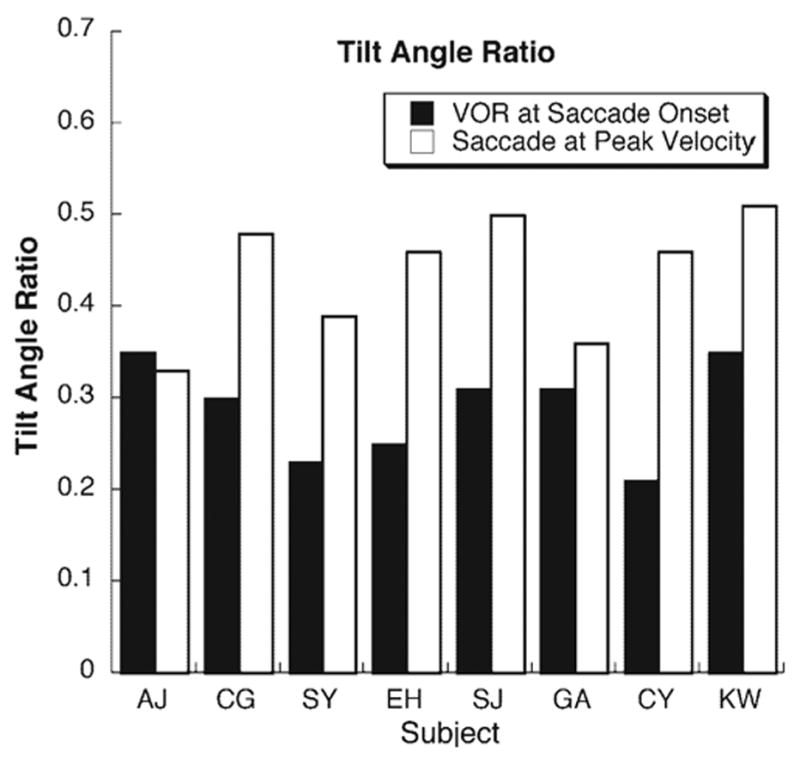
TAR for each subject at the start and at velocity peak of vertical saccades during the VOR. Data represents the average of both eyes of each subject when binocular data was available.
Official websites use .gov
A
.gov website belongs to an official
government organization in the United States.
Secure .gov websites use HTTPS
A lock (
) or https:// means you've safely
connected to the .gov website. Share sensitive
information only on official, secure websites.
TAR for each subject at the start and at velocity peak of vertical saccades during the VOR. Data represents the average of both eyes of each subject when binocular data was available.