
Figure 2.
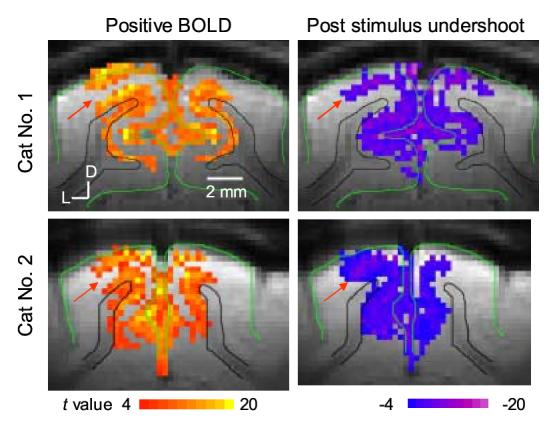
BOLD maps vs. post-stimulus BOLD undershoot maps. t-value maps of positive BOLD (left) and post-stimulus BOLD undershoot (right) were obtained from TE-averaged data in two cats. Images acquired during a stimulation period except initial 8 sec and during 12-36 sec after cessation of stimulation were used for positive and post-stimulus BOLD maps, respectively. To minimize the influence of different CNRs for positive BOLD and post-stimulus BOLD undershoot, 1000 pixels with highest t values were chosen by adjusting the threshold individually. D: dorsal, L: lateral.