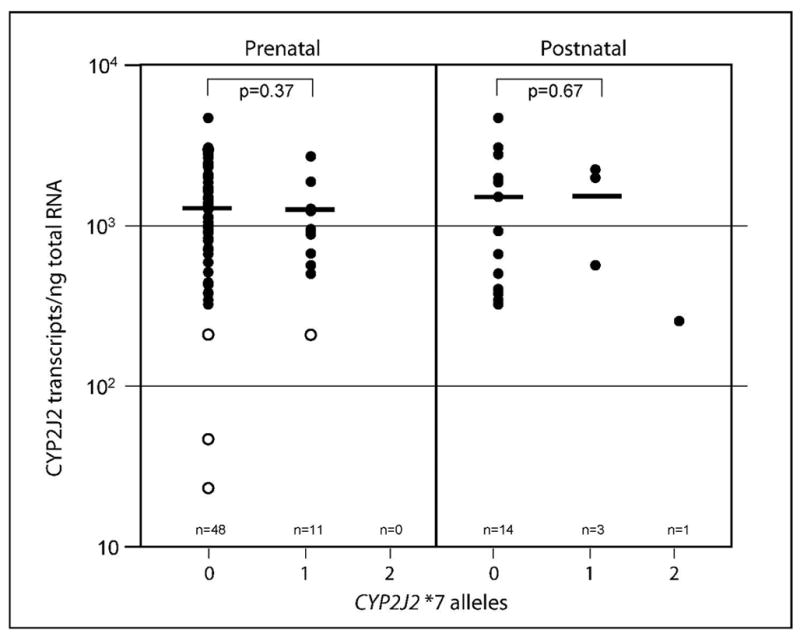
Figure 2. Relationship between CYP2J2 mRNA expression and genotype.

The figure shows the relationship between the number of transcripts/ng total RNA and the presence of zero (0), one (1) or two (2) CYP2J2*7 alleles. There was no significant difference between samples with zero and one CYP2J2*7 alleles regardless whether the four samples with low transcript numbers were included (p=0.71) or excluded (p=0.37). No CYP2J2*2-*6 allelic variants were found. The graph contains fetal and postnatal samples. The samples circled in Figure 1A are shown with open circles; the bar indicates the mean transcript number.
