
FIG. 3.
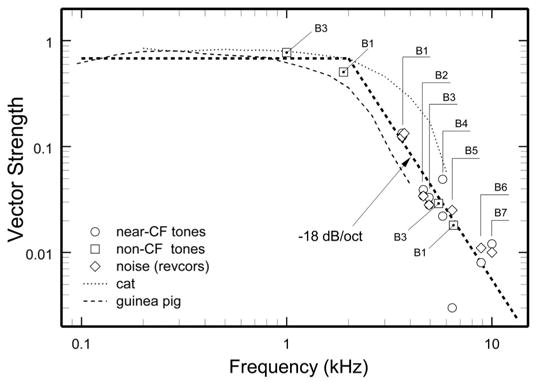
Strength of phase locking as a function of CF in ANF responses to noise and tones. Thick dashed line indicates the trend of the magnitude of the 1st-order cross-correlograms (revcors) normalized to stimulus amplitude [from Fig. 12 of the companion paper (Recio-Spinoso et al. 2005)]. This measure is the noise-response analog of vector strength for responses to tones (Goldberg and Brown 1969). Also shown are vector strengths for near-CF tone (diamonds) and noise (triangles) data obtained from 7 fibers (identified as B1–B7) in 2 chinchillas. (Corresponding phases are shown in Fig. 5B; see also the legend of Fig. 5 for ANF sensitivity and noise levels.) Squares indicate vector strengths for non-CF tone data from fibers B1 and B3 of Fig. 5B; B1: CF = 3,646 Hz, tones at 1,890 Hz (68 dB SPL) and 5,500 Hz (67 dB SPL); B3: CF = 4,927 Hz, tones at 1,000 Hz (61 dB SPL) and at 6,500 Hz (58 dB SPL). Diamonds and triangles represent, respectively, the vector strength of responses to CF tones and the normalized magnitudes of responses to noise measured in the same ANFs. For all but one tone response of ANFs B1–B4, phase locking was statistically significant (2nVS2 >10; P < 0.005). Tone responses of ANFs B5–B7 were not significantly phase locked in a statistical sense. Also shown are trend lines for vector strength at CF computed from responses to tones in cat (dotted line) and guinea pig (dashed line), taken from Fig. 3 of Weiss and Rose (1988), which summarized data of Johnson (1980) and Palmer and Russell (1986).