
FIG. 9.
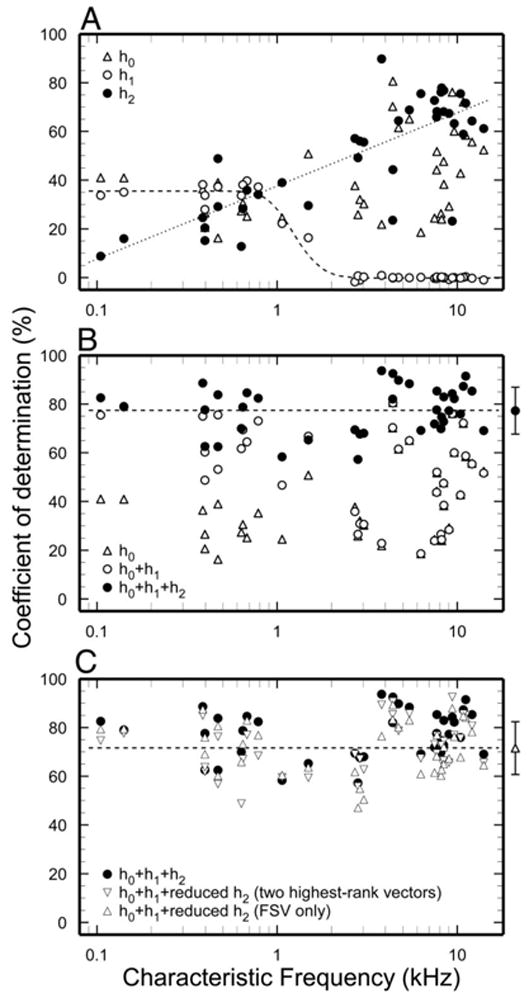
Quantitative estimates of the quality of predictions of responses to frozen noise based on Wiener-kernel analysis. Quality of the predictions of responses from 38 ANFs from 4 chinchillas is quantified using the COD (expressed as a percentage; see Eq. 3). Abscissa indicates CF. Noise spectral pressure level at CF averaged 1.6 ± 14.5 dB SPL/Hz (n = 38); equivalently, noise total pressure in ERB 29.2 ± 13.8 dB SPL. A: CODs for the individual predictions of h0, h1, and h2 are indicated by the triangles and the open and closed circles, respectively. A smoothed step function (dashed line) accurately fits the variation with log CF of the COD based solely on h1 (r2 = 0.98). A linear function of log CF (dotted line) fits somewhat less well (r2 = 0.64) the variation with CF of the COD based solely on h2. B: CODs for predictions based on h0 individually (triangles), h0 and h1 jointly (open circles), and by all 3 kernels jointly (closed circles). Bracketed closed circle at right and the dashed line indicate the average COD for predictions based on all 3 kernels jointly, ±SD (77.4 ± 9.7%, n = 38). C: COD for the joint predictions of h0, h1, and a reduced h2. Reduced h2s were constructed on the basis of the 2 highest-rank singular vectors (downward triangles) or the h2-FSV only (upward triangles). Bracketed upward triangle at right and the dashed line indicate the average COD for predictions based on zeroth-, 1st-, and reduced (h2-FSV only) 2nd-order kernel, ±SD (71.6 ± 10.8%, n = 38). See text for details.